Note
Click here to download the full example code
Learn with Random-Forest and Random Sampling 50% (RS50)
This example shows how to make a Random Sampling with 50% for each class.
Import librairies
from museotoolbox.ai import SuperLearner
from museotoolbox.cross_validation import RandomStratifiedKFold
from museotoolbox.processing import extract_ROI
from museotoolbox import datasets
from sklearn.ensemble import RandomForestClassifier
from sklearn import metrics
Load HistoricalMap dataset
raster,vector = datasets.load_historical_data(low_res=True)
field = 'Class'
X,y = extract_ROI(raster,vector,field)
Create CV
SKF = RandomStratifiedKFold(n_splits=2,
                random_state=12,verbose=False)
Initialize Random-Forest and metrics
classifier = RandomForestClassifier(random_state=12,n_jobs=1)

#
kappa = metrics.make_scorer(metrics.cohen_kappa_score)
f1_mean = metrics.make_scorer(metrics.f1_score,average='micro')
scoring = dict(kappa=kappa,f1_mean=f1_mean,accuracy='accuracy')
Start learning
sklearn will compute different metrics, but will keep best results from kappa (refit=’kappa’)
SL = SuperLearner(classifier=classifier,param_grid = dict(n_estimators=[10]),n_jobs=1,verbose=1)

SL.fit(X,y,cv=SKF,scoring=kappa)
Out:
Fitting 2 folds for each of 1 candidates, totalling 2 fits
[Parallel(n_jobs=1)]: Using backend SequentialBackend with 1 concurrent workers.
[Parallel(n_jobs=1)]: Done   2 out of   2 | elapsed:    0.1s finished
best score : 0.8895913422168493
best n_estimators : 10
Read the model
print(SL.model)
print(SL.model.cv_results_)
print(SL.model.best_score_)
Out:
GridSearchCV(cv=<museotoolbox.cross_validation.RandomStratifiedKFold object at 0x7f4a168fe050>,
             error_score=nan,
             estimator=RandomForestClassifier(bootstrap=True, ccp_alpha=0.0,
                                              class_weight=None,
                                              criterion='gini', max_depth=None,
                                              max_features='auto',
                                              max_leaf_nodes=None,
                                              max_samples=None,
                                              min_impurity_decrease=0.0,
                                              min_impurity_split=None,
                                              min_samples_leaf=1,
                                              min_samples_split=2,
                                              min_weight_fraction_leaf=0.0,
                                              n_estimators=100, n_jobs=1,
                                              oob_score=False, random_state=12,
                                              verbose=0, warm_start=False),
             iid='deprecated', n_jobs=1, param_grid={'n_estimators': [10]},
             pre_dispatch='2*n_jobs', refit=True, return_train_score=False,
             scoring=make_scorer(cohen_kappa_score), verbose=1)
{'mean_fit_time': array([0.02235031]), 'std_fit_time': array([0.00077629]), 'mean_score_time': array([0.00488162]), 'std_score_time': array([3.57627869e-06]), 'param_n_estimators': masked_array(data=[10],
             mask=[False],
       fill_value='?',
            dtype=object), 'params': [{'n_estimators': 10}], 'split0_test_score': array([0.90341985]), 'split1_test_score': array([0.87576284]), 'mean_test_score': array([0.88959134]), 'std_test_score': array([0.01382851]), 'rank_test_score': array([1], dtype=int32)}
0.8895913422168493
Get F1 for every class from best params
for stats in SL.get_stats_from_cv(confusion_matrix=False,F1=True):
    print(stats['F1'])
Out:
[Parallel(n_jobs=1)]: Using backend SequentialBackend with 1 concurrent workers.
[Parallel(n_jobs=1)]: Done   2 out of   2 | elapsed:    0.1s finished
[0.9706191  0.85152057 0.99824253 0.73170732 0.        ]
[0.95802728 0.81441441 0.99647887 0.703125   0.        ]
Get each confusion matrix from folds
for stats in SL.get_stats_from_cv(confusion_matrix=True):
    print(stats['confusion_matrix'])
Out:
[Parallel(n_jobs=1)]: Using backend SequentialBackend with 1 concurrent workers.
[Parallel(n_jobs=1)]: Done   2 out of   2 | elapsed:    0.1s finished
[[925  16   0   1   0]
 [ 37 238   0  11   0]
 [  0   0 284   0   0]
 [  1  19   1  45   0]
 [  1   0   0   0   0]]
[[913  25   0   4   0]
 [ 49 226   0  11   0]
 [  0   0 283   1   0]
 [  2  18   1  45   0]
 [  0   0   0   1   0]]
Save each confusion matrix from folds
SL.save_cm_from_cv('/tmp/testMTB/',prefix='RS50_')
Out:
[Parallel(n_jobs=1)]: Using backend SequentialBackend with 1 concurrent workers.
[Parallel(n_jobs=1)]: Done   1 out of   1 | elapsed:    0.0s remaining:    0.0s
[Parallel(n_jobs=1)]: Done   2 out of   2 | elapsed:    0.1s finished
Predict map
SL.predict_image(raster,'/tmp/classification.tif',
                  higher_confidence='/tmp/confidence.tif',
                  confidence_per_class='/tmp/confidencePerClass.tif')
Out:
Total number of blocks : 6
Detected 1 band for function predict_array.
Detected 5 bands for function predict_confidence_per_class.
Detected 1 band for function predict_higher_confidence.

Prediction... [........................................]0%

Prediction... [######..................................]16%

Prediction... [#############...........................]33%

Prediction... [####################....................]50%

Prediction... [##########################..............]66%

Prediction... [#################################.......]83%

Prediction... [########################################]100%
Saved /tmp/classification.tif using function predict_array
Saved /tmp/confidencePerClass.tif using function predict_confidence_per_class
Saved /tmp/confidence.tif using function predict_higher_confidence
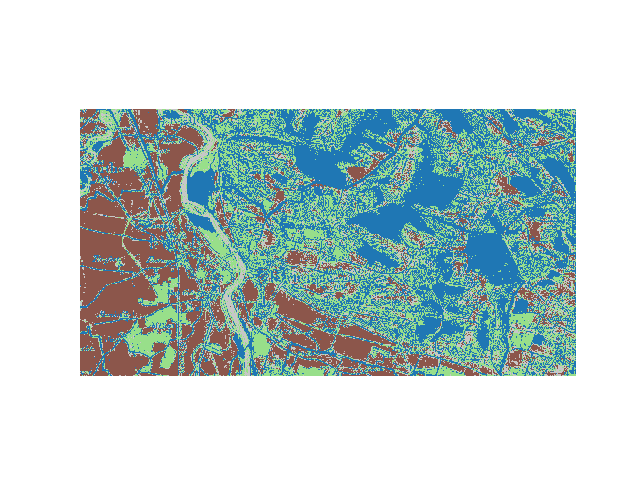
Plot example
from matplotlib import pyplot as plt
from osgeo import gdal
src=gdal.Open('/tmp/classification.tif')
plt.imshow(src.GetRasterBand(1).ReadAsArray(),cmap=plt.get_cmap('tab20'))
plt.axis('off')
plt.show()
Total running time of the script: ( 0 minutes 1.031 seconds)