Note
Click here to download the full example code
Sequential Forward Feature Selection (SFFS)
This example shows how to make a Random Sampling with 50% for each class.
Import librairies
from museotoolbox.ai import SequentialFeatureSelection
from museotoolbox.cross_validation import LeavePSubGroupOut
from museotoolbox import datasets
from sklearn.ensemble import RandomForestClassifier
from sklearn import metrics
import numpy as np
Load HistoricalMap dataset
X,y,g = datasets.load_historical_data(return_X_y_g=True,low_res=True)
Create CV
LSGO = LeavePSubGroupOut(valid_size=0.8,n_repeats=2,
                random_state=12,verbose=False)
Initialize Random-Forest and metrics
classifier = RandomForestClassifier(random_state=12,n_jobs=1)

kappa = metrics.make_scorer(metrics.cohen_kappa_score)
Set and fit the Sequentia Feature Selection
SFFS = SequentialFeatureSelection(classifier=classifier,param_grid=dict(n_estimators=[10,20]),verbose=False)

SFFS.fit(X.astype(np.float),y,g,cv=LSGO,max_features=2)
Show best features and score
print('Best features are : '+str(SFFS.best_features_))
print('Kappa are : '+str(SFFS.best_scores_))
Out:
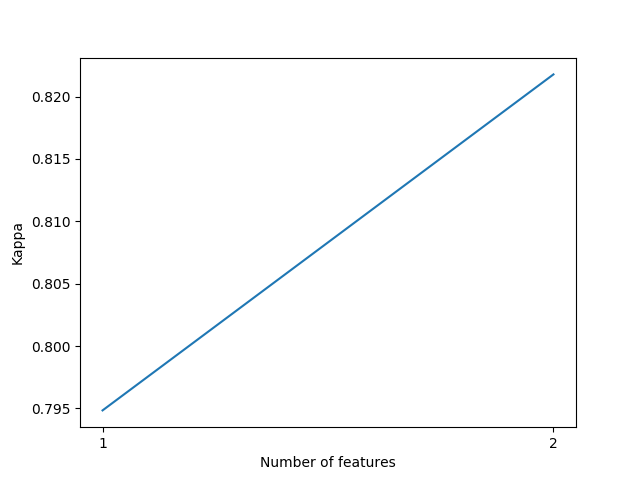
Best features are : [2, 1]
Kappa are : [0.7948371492024503, 0.8217832688358999]
In order to predict every classification from the best feature
SFFS.predict_best_combination(datasets.load_historical_data()[0],'/tmp/SFFS/best_classification.tif')
Out:
Predict with combination 1
Total number of blocks : 15
Detected 1 band for function predict_array.

Prediction... [........................................]0%

Prediction... [##......................................]6%

Prediction... [#####...................................]13%

Prediction... [########................................]20%

Prediction... [##########..............................]26%

Prediction... [#############...........................]33%

Prediction... [################........................]40%

Prediction... [##################......................]46%

Prediction... [#####################...................]53%

Prediction... [########################................]60%

Prediction... [##########################..............]66%

Prediction... [#############################...........]73%

Prediction... [################################........]80%

Prediction... [##################################......]86%

Prediction... [#####################################...]93%

Prediction... [########################################]100%
Saved /tmp/SFFS/best_classification.tif using function predict_array
Plot example
from matplotlib import pyplot as plt
plt.plot(np.arange(1,len(SFFS.best_scores_)+1),SFFS.best_scores_)
plt.xlabel('Number of features')
plt.xticks(np.arange(1,len(SFFS.best_scores_)+1))
plt.ylabel('Kappa')
plt.show()
Total running time of the script: ( 0 minutes 3.364 seconds)