Note
Click here to download the full example code
Raster mask from vector
Create a raster mask from vector.
Import librairies
from museotoolbox.processing import image_mask_from_vector
from museotoolbox.datasets import load_historical_data
Load HistoricalMap dataset
raster,vector = load_historical_data()
Rasterize vector
Default, invert is False, it means only polygons will be kept (the rest is set to nodata)
image_mask_from_vector(vector,raster,'/tmp/mask.tif',invert=False)
If invert is set to True, it means polygons will be set to nodata
image_mask_from_vector(vector,raster,'/tmp/maskInvert.tif',invert=True)
Plot result
from osgeo import gdal
from matplotlib import pyplot as plt
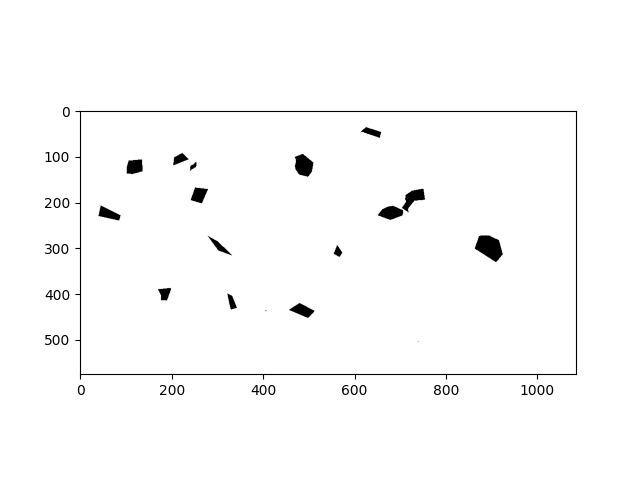
Default mask (invert=False)
white is nodata, black is 255
src = gdal.Open('/tmp/mask.tif')
plt.imshow(src.ReadAsArray(),cmap='Greys')
Out:
<matplotlib.image.AxesImage object at 0x7f7fdf6615d0>
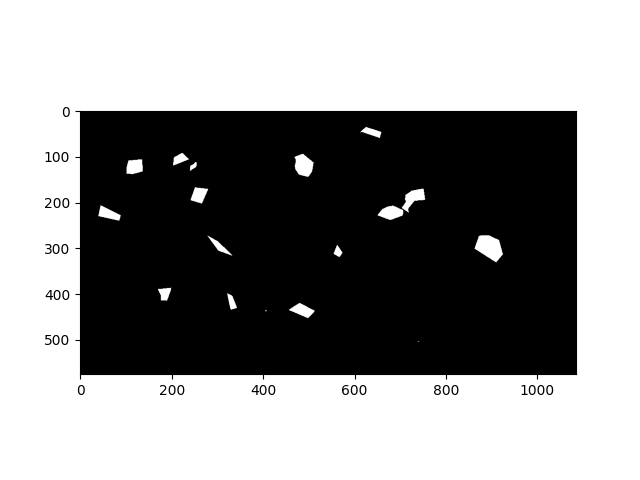
invert mask (invert=True)
white is nodata, black is 255
src = gdal.Open('/tmp/maskInvert.tif')
plt.imshow(src.ReadAsArray(),cmap='Greys')
Out:
<matplotlib.image.AxesImage object at 0x7f7fdf6a4f10>
Total running time of the script: ( 0 minutes 0.271 seconds)