Note
Click here to download the full example code
Modal class and number of agreements
Create a raster with the modal class and the number of agreements.
Import librairies
import museotoolbox as mtb
from scipy.stats import mode
import numpy as np
Load HistoricalMap dataset
raster,vector = mtb.datasets.load_historical_data(low_res=True)
Initialize rasterMath with raster
########
# In case you want to add a mask
mask = '/tmp/maskFromPolygons.tif'

mtb.processing.image_mask_from_vector(vector,raster,out_image = mask)

rM = mtb.processing.RasterMath(raster,in_image_mask=mask)

print(rM.get_random_block())
Out:
Total number of blocks : 6
[[-- -- --]
 [-- -- --]
 [-- -- --]
 [-- -- --]
 [-- -- --]
 [-- -- --]
 [-- -- --]
 [-- -- --]
 [-- -- --]
 [-- -- --]
 [-- -- --]
 [-- -- --]
 [-- -- --]
 [-- -- --]
 [-- -- --]
 [-- -- --]
 [-- -- --]
 [-- -- --]
 [-- -- --]
 [-- -- --]
 [-- -- --]
 [-- -- --]
 [-- -- --]
 [-- -- --]
 [-- -- --]
 [-- -- --]
 [-- -- --]
 [-- -- --]
 [-- -- --]
 [-- -- --]
 [-- -- --]
 [-- -- --]
 [-- -- --]
 [-- -- --]
 [-- -- --]
 [-- -- --]
 [-- -- --]
 [-- -- --]
 [-- -- --]
 [-- -- --]
 [-- -- --]
 [-- -- --]
 [-- -- --]
 [-- -- --]
 [-- -- --]
 [-- -- --]
 [-- -- --]
 [-- -- --]
 [-- -- --]
 [-- -- --]
 [-- -- --]
 [-- -- --]
 [-- -- --]
 [-- -- --]
 [-- -- --]
 [-- -- --]
 [-- -- --]
 [-- -- --]
 [-- -- --]
 [-- -- --]
 [-- -- --]
 [-- -- --]
 [-- -- --]
 [-- -- --]
 [-- -- --]
 [-- -- --]
 [-- -- --]
 [-- -- --]
 [-- -- --]
 [-- -- --]
 [-- -- --]
 [-- -- --]
 [-- -- --]
 [-- -- --]
 [-- -- --]
 [-- -- --]
 [-- -- --]
 [-- -- --]
 [-- -- --]
 [-- -- --]
 [-- -- --]
 [-- -- --]
 [-- -- --]
 [-- -- --]
 [-- -- --]
 [-- -- --]
 [-- -- --]
 [-- -- --]
 [-- -- --]
 [-- -- --]
 [-- -- --]
 [-- -- --]
 [-- -- --]
 [-- -- --]
 [-- -- --]
 [-- -- --]
 [-- -- --]
 [-- -- --]
 [-- -- --]
 [-- -- --]]
Let’s suppose you want compute the modal classification between several predictions The first band will be the most predicted class, and the second the number of times it has been predicted.
x = rM.get_random_block()

def modal_class(x):
    tmpStack = np.column_stack(mode(x,axis=1)).astype(np.int16)
    return tmpStack

modal_class(x)

rM.add_function(modal_class,out_image='/tmp/modal.tif',out_nodata=0)
Out:
Using datatype from numpy table : int16.
Detected 2 bands for function modal_class.
No data is set to : 0.
Run the script
rM.run()
Out:
Batch processing (6 blocks using 3Mo of ram)

rasterMath... [######..................................]16%

rasterMath... [#############...........................]33%

rasterMath... [####################....................]50%

rasterMath... [##########################..............]66%

rasterMath... [#################################.......]83%

rasterMath... [########################################]100%
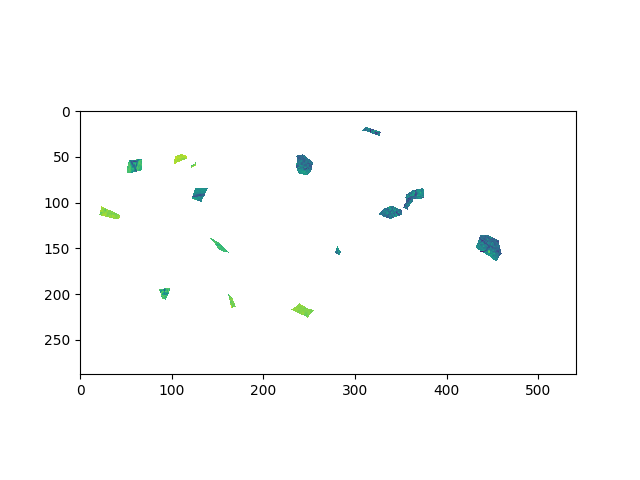
Plot result
from osgeo import gdal
from matplotlib import pyplot as plt

src = gdal.Open('/tmp/modal.tif')
data = src.ReadAsArray()[0,:,:]
data = np.where(data== 0,np.nan,data)
plt.imshow(data)
Out:
<matplotlib.image.AxesImage object at 0x7f7fdf8abbd0>
Total running time of the script: ( 0 minutes 3.843 seconds)