Note
Click here to download the full example code
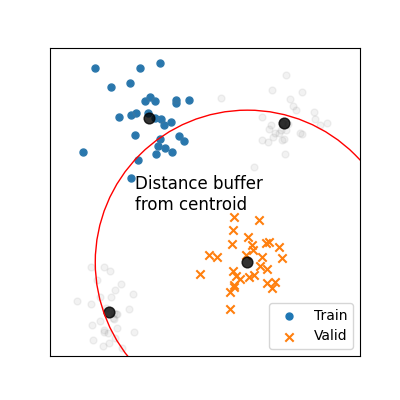
Spatial Leave-One-SubGroup-Out (SLOSGO)
This example shows how to make a Spatial Leave-One-SubGroup-Out.
Import librairies
import numpy as np
from museotoolbox.cross_validation import SpatialLeaveOneSubGroupOut
from museotoolbox import datasets,processing
Load HistoricalMap dataset
_,centroid = datasets.load_historical_data(low_res=True,centroid=True)
raster,vector = datasets.load_historical_data(low_res=True)

field = 'Class'
Extract label (‘Class’ field) and groups (‘uniquefid’ field) Compute distanceMatrix with centroid (one point per group)
X,y,groups = processing.extract_ROI(raster,vector,field,'uniquefid')
distance_matrix,distance_label = processing.get_distance_matrix(raster,centroid,'uniquefid')
Create CV
n_splits will be the number of the least populated class
SLOSGO = SpatialLeaveOneSubGroupOut(distance_thresold=100,distance_matrix=distance_matrix,
                                   distance_label=distance_label,random_state=12)
Note
Split is made to generate each fold
SLOSGO.get_n_splits(X,y,groups)
for tr,vl in SLOSGO.split(X,y,groups):
    print(np.unique(groups[vl]))
    print(np.unique(groups[tr]))

SLOSGO.save_to_vector(vector,'Class','uniquefid','/tmp/slosgo.gpkg')
Out:
[ 7  9 11 12 16]
[ 1  2  3  4  5  6  8 10 13 14 15]
[ 2  5 13 14 17]
[ 1  4  6  7  9 11 12 15]
Warning : This function generates vector files according to your vector.
        The number of features may differ from the number of pixels used in classification.
        If you want to save every ROI pixels in the vector, please use processing.sample_extraction before.

[['/tmp/slosgo_train_0.gpkg', '/tmp/slosgo_valid_0.gpkg'], ['/tmp/slosgo_train_1.gpkg', '/tmp/slosgo_valid_1.gpkg']]
Draw image
from __drawCVmethods import plotMethod
plotMethod('SLOO-group')
Out:
/home/docs/checkouts/readthedocs.org/user_builds/museotoolbox/checkouts/latest/examples/cross_validation/__drawCVmethods.py:35: MatplotlibDeprecationWarning: Adding an axes using the same arguments as a previous axes currently reuses the earlier instance.  In a future version, a new instance will always be created and returned.  Meanwhile, this warning can be suppressed, and the future behavior ensured, by passing a unique label to each axes instance.
  ax = f.add_subplot(111)
Total running time of the script: ( 0 minutes 0.163 seconds)