Note
Click here to download the full example code
Spatial Leave-Aside-Out (SLAO)
This example shows how to make a Spatial Leave-Aside-Out.
See https://doi.org/10.1016/j.foreco.2013.07.059
Import librairies
from museotoolbox.cross_validation import SpatialLeaveAsideOut
from museotoolbox import datasets,processing
Load HistoricalMap dataset
raster,vector = datasets.load_historical_data()
field = 'Class'
X,y = processing.extract_ROI(raster,vector,field)
distance_matrix = processing.get_distance_matrix(raster,vector)
Create CV
n_splits will be the number of the least populated class
SLOPO = SpatialLeaveAsideOut(valid_size=1/3,
                             distance_matrix=distance_matrix,random_state=4)

print(SLOPO.get_n_splits(X,y))
Out:
3
Note
Split is made to generate each fold
for tr,vl in SLOPO.split(X,y):
    print(tr.shape,vl.shape)
Out:
(8373,) (4284,)
(8425,) (4232,)
(8407,) (4250,)
Save each train/valid fold in a file
In order to translate polygons into points (each points is a pixel in the raster) we use sampleExtraction from vector_tools to generate a temporary vector.
processing.sample_extraction(raster,vector,out_vector='/tmp/pixels.gpkg',verbose=False)
trvl = SLOPO.save_to_vector('/tmp/pixels.gpkg',field,out_vector='/tmp/SLOPO.gpkg')
for tr,vl in trvl:
    print(tr,vl)
Out:
/tmp/SLOPO_train_0.gpkg /tmp/SLOPO_valid_0.gpkg
/tmp/SLOPO_train_1.gpkg /tmp/SLOPO_valid_1.gpkg
/tmp/SLOPO_train_2.gpkg /tmp/SLOPO_valid_2.gpkg
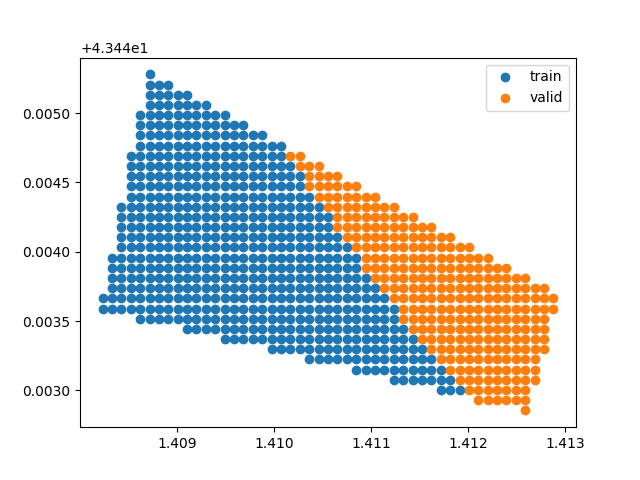
Plot example on how a polygon was splitted
import ogr
import numpy as np
from matplotlib import pyplot as plt
# Read all features in layer and store as paths
xyl= np.array([],dtype=float).reshape((-1,3))
for idx,vector in enumerate([tr,vl]):
    ds = ogr.Open(vector)
    lyr = ds.GetLayer(0)
    lyr.SetAttributeFilter ( "uniquefid=17" ) # select a specific group
    for feat in lyr:
        geom = feat.GetGeometryRef()
        xyl = np.vstack((xyl,np.asarray((geom.GetX(),geom.GetY(),idx))))

trPoints = xyl[xyl[:,2]==0][:,:2]
vlPoints = xyl[xyl[:,2]==1][:,:2]
plt.scatter(trPoints[:,0],trPoints[:,1],label='train',color='C0')
plt.scatter(vlPoints[:,0],vlPoints[:,1],label='valid',color='C1')
plt.legend()
plt.show()
Total running time of the script: ( 0 minutes 5.695 seconds)