Note
Click here to download the full example code
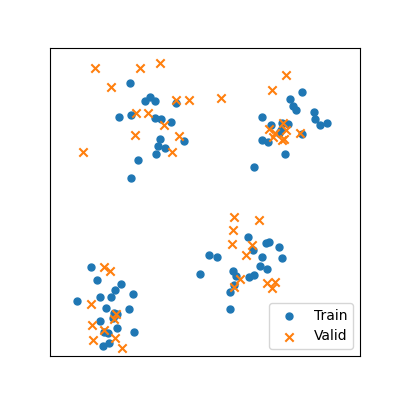
Stratified-K-Fold
This example shows how to make a Random Sampling with 50% for each class.
Import librairies
from museotoolbox.cross_validation import RandomStratifiedKFold
from museotoolbox import datasets,processing
Load HistoricalMap dataset
raster,vector = datasets.load_historical_data(low_res=True)
field = 'Class'
y = processing.read_vector_values(vector,field)
Create CV
SKF = RandomStratifiedKFold(n_splits=2,n_repeats=2,
                random_state=12,verbose=False)
for tr,vl in SKF.split(X=None,y=y):
    print(tr,vl)
Out:
[ 2  3  8  6  9 15 16 12 13] [ 0  7  1  4  5 14 10 11]
[ 0  1  7  4  5 14 15 10 11] [ 3  2  8  9  6 16 12 13]
[ 0  3  7  4  9 14 16 12 13] [ 8  1  2  5  6 15 10 11]
[ 1  2  8  5  6 14 15 10 11] [ 7  3  0  9  4 16 12 13]
Note
Split is made to generate each fold
# Show label

for tr,vl in SKF.split(X=None,y=y):
    print(y[tr],y[vl])
Out:
[1 1 1 2 2 3 3 4 5] [1 1 1 2 2 3 4 5]
[1 1 1 2 2 3 3 4 5] [1 1 1 2 2 3 4 5]
[1 1 1 2 2 3 3 4 5] [1 1 1 2 2 3 4 5]
[1 1 1 2 2 3 3 4 5] [1 1 1 2 2 3 4 5]
Note
The first one is made with polygon only. When learning/predicting, all pixels will be taken in account TO generate a full X and y labels, extract samples from ROI
X,y=processing.extract_ROI(raster,vector,field)

for tr,vl in SKF.split(X,y):
    print(tr,vl)
    print(tr.shape,vl.shape)
Out:
[   0    1    2 ... 2997 2998 3174] [1320  220 1316 ... 2847 2899 3046]
(1588,) (1587,)
[   3    4    5 ... 2976 2996 3046] [1096 1130 1522 ... 2793 2895 3174]
(1588,) (1587,)
[   1    2    4 ... 2995 2998 3174] [1057  903  904 ... 2898 2845 3046]
(1588,) (1587,)
[   0    3    6 ... 2996 2997 3046] [1337 2254 1247 ...  536  625 3174]
(1588,) (1587,)
Plot example
from __drawCVmethods import plotMethod
plotMethod('SKF-pixel')
Out:
/home/docs/checkouts/readthedocs.org/user_builds/museotoolbox/checkouts/latest/examples/cross_validation/__drawCVmethods.py:35: MatplotlibDeprecationWarning: Adding an axes using the same arguments as a previous axes currently reuses the earlier instance.  In a future version, a new instance will always be created and returned.  Meanwhile, this warning can be suppressed, and the future behavior ensured, by passing a unique label to each axes instance.
  ax = f.add_subplot(111)
Total running time of the script: ( 0 minutes 0.106 seconds)