Note
Click here to download the full example code
rasterMath with several rasters as inputs
Compute substract and addition between two raster bands.
Import librairies
from museotoolbox.processing import RasterMath,image_mask_from_vector
from museotoolbox import datasets
import numpy as np
Load HistoricalMap dataset
raster,vector = datasets.load_historical_data()
Initialize rasterMath with raster
If invert is set to True, it means polygons will be set to nodata
image_mask_from_vector(vector,raster,'/tmp/mask.tif',invert=False)
rM = RasterMath(in_image = raster,in_image_mask='/tmp/mask.tif',return_3d=True)

rM.add_image(raster)

print('Number of rasters : '+str(len(rM.get_random_block())))
Out:
Total number of blocks : 15
Number of rasters : 2
Let’s suppose you want compute the substraction between the blue and green band of two inputs I suggest you to define type in numpy array to save space while creating the raster!
x = rM.get_random_block()

def sub(x):
    firstBandOfFirstRaster = x[0][...,0]
    thirdBandOfSecondRaster = x[1][...,2]
    difference = np.array(firstBandOfFirstRaster-thirdBandOfSecondRaster,dtype=np.uint8)
    return difference

rM.add_function(sub,out_image='/tmp/sub_2inputs.tif')
Out:
Using datatype from numpy table : uint8.
Detected 1 band for function sub.
No data is set to : 0
Run the script
rM.run()
Out:
rasterMath... [........................................]0%

rasterMath... [##......................................]6%

rasterMath... [#####...................................]13%

rasterMath... [########................................]20%

rasterMath... [##########..............................]26%

rasterMath... [#############...........................]33%

rasterMath... [################........................]40%

rasterMath... [##################......................]46%

rasterMath... [#####################...................]53%

rasterMath... [########################................]60%

rasterMath... [##########################..............]66%

rasterMath... [#############################...........]73%

rasterMath... [################################........]80%

rasterMath... [##################################......]86%

rasterMath... [#####################################...]93%

rasterMath... [########################################]100%
Saved /tmp/sub_2inputs.tif using function sub
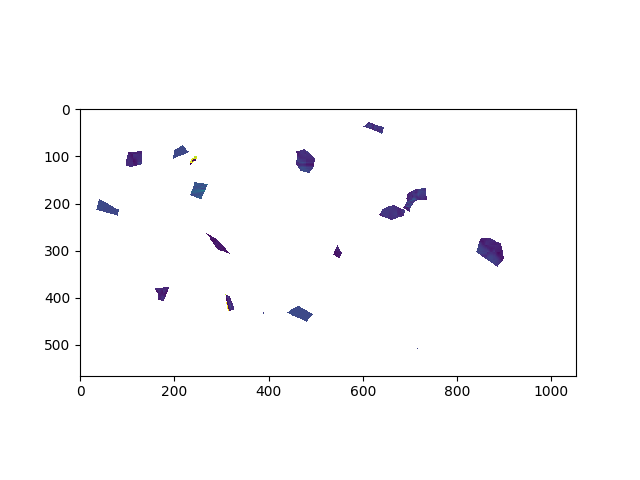
Plot result
from osgeo import gdal
from matplotlib import pyplot as plt

src = gdal.Open('/tmp/sub_2inputs.tif')
arr = src.ReadAsArray()
arr = np.where(arr==0,np.nan,arr)
plt.imshow(arr)
Out:
<matplotlib.image.AxesImage object at 0x7f4a19d03fd0>
Total running time of the script: ( 0 minutes 0.297 seconds)