Note
Click here to download the full example code
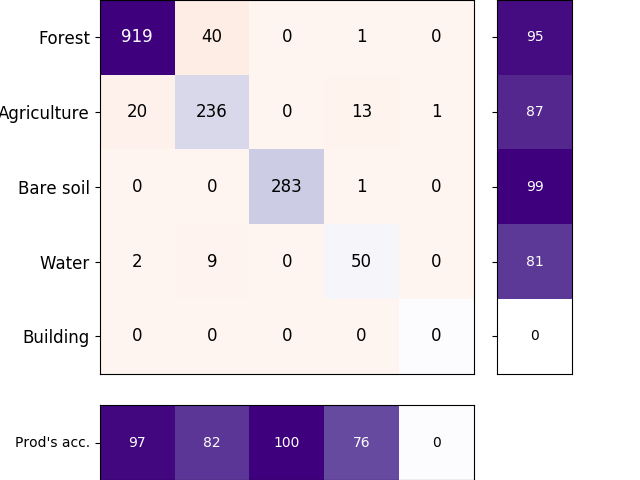
Plot confusion matrix with User/Producer accuracy
Plot confusion matrix from Cross-Validation, with accuracy (user/prod) as subplot.
Import librairies
from museotoolbox.ai import SuperLearner
from museotoolbox.cross_validation import RandomStratifiedKFold
from museotoolbox.charts import PlotConfusionMatrix
from museotoolbox import datasets
from sklearn.ensemble import RandomForestClassifier
Load HistoricalMap dataset
X,y = datasets.load_historical_data(low_res=True,return_X_y=True)
Create CV
RSKF = RandomStratifiedKFold(n_splits=2,
                random_state=12,verbose=False)
Initialize Random-Forest
classifier = RandomForestClassifier()
Start learning
SL = SuperLearner(classifier=classifier,param_grid=dict(n_estimators=[10,100]))
SL.fit(X,y,cv=RSKF)
Get kappa from each fold
for stats in SL.get_stats_from_cv(confusion_matrix=False,kappa=True):
    print(stats['kappa'])
Out:
0.9193712091695515
0.8758582444465504
Get each confusion matrix from folds
cms = []
for stats in SL.get_stats_from_cv(confusion_matrix=True):
    cms.append(stats['confusion_matrix'])
    print(stats['confusion_matrix'])
Out:
[[923  18   0   1   0]
 [ 31 245   0  10   0]
 [  0   0 284   0   0]
 [  1   9   1  55   0]
 [  0   1   0   0   0]]
[[915  23   0   4   0]
 [ 49 228   0   9   0]
 [  0   0 283   1   0]
 [  1  18   2  45   0]
 [  0   1   0   0   0]]
Plot confusion matrix
import numpy as np

# a bug in Sphinx doesn't show the whole plot, sorry.

labels = ['Forest','Agriculture','Bare soil','Water','Building']
from matplotlib.pyplot import cm as colorMap
meanCM = np.mean(cms,axis=0).astype(np.int16)
pltCM = PlotConfusionMatrix(meanCM.T) # Translate for Y = prediction and X = truth
pltCM.add_text()
pltCM.add_x_labels(labels,rotation=90)
pltCM.add_y_labels(labels)
pltCM.color_diagonal(diag_color=colorMap.Purples,matrix_color=colorMap.Reds)
pltCM.add_accuracy()
Total running time of the script: ( 0 minutes 2.112 seconds)