Note
Click here to download the full example code
Basics to use rasterMath
Compute substract and addition between two raster bands.
Import librairies
from museotoolbox.processing import RasterMath
from museotoolbox import datasets
import numpy as np
Load HistoricalMap dataset
raster,vector = datasets.load_historical_data()
Initialize rasterMath with raster
rM = RasterMath(raster)

print(rM.get_random_block())
Out:
Total number of blocks : 15
[[69 69 41]
 [119 119 91]
 [141 142 111]
 [59 60 29]
 [119 120 89]
 [96 97 66]
 [73 74 43]
 [112 113 82]
 [122 123 92]
 [78 79 48]
 [133 134 103]
 [70 71 40]
 [117 118 87]
 [92 93 62]
 [84 85 54]
 [121 122 91]
 [78 72 46]
 [116 110 84]
 [99 93 67]
 [128 122 96]
 [119 113 87]
 [113 107 81]
 [138 133 104]
 [66 61 32]
 [126 121 92]
 [116 111 81]
 [128 123 93]
 [115 110 80]
 [91 86 56]
 [134 129 99]
 [126 121 89]
 [111 106 74]
 [118 131 88]
 [113 115 76]
 [101 86 53]
 [144 108 82]
 [138 86 64]
 [147 86 67]
 [162 101 83]
 [176 125 104]
 [198 164 139]
 [177 160 132]
 [158 151 122]
 [140 136 109]
 [162 156 132]
 [186 170 154]
 [173 149 137]
 [172 144 133]
 [108 85 67]
 [185 162 144]
 [188 165 133]
 [186 163 131]
 [165 148 122]
 [185 168 142]
 [192 175 149]
 [200 183 157]
 [179 162 136]
 [210 193 167]
 [198 181 155]
 [192 175 149]
 [184 167 141]
 [179 162 136]
 [120 103 77]
 [112 95 69]
 [121 104 78]
 [128 111 85]
 [83 66 40]
 [198 181 155]
 [160 143 127]
 [124 107 91]
 [74 56 42]
 [88 70 58]
 [107 89 79]
 [103 86 78]
 [102 85 78]
 [97 80 73]
 [94 79 72]
 [99 85 76]
 [70 56 45]
 [77 63 50]
 [68 57 39]
 [85 74 54]
 [50 39 17]
 [61 51 26]
 [66 54 30]
 [70 58 34]
 [72 60 36]
 [83 71 47]
 [125 113 89]
 [161 149 125]
 [186 174 152]
 [152 140 118]
 [148 136 114]
 [192 179 160]
 [157 144 125]
 [98 85 66]
 [119 106 87]
 [72 59 42]
 [54 41 24]
 [63 50 33]]
Let’s suppose you want compute the difference between blue and green band. I suggest you to define type in numpy array to save space while creating the raster!
X = rM.get_random_block()

sub = lambda X : np.array((X[:,0]-X[:,1])).astype(np.int16)


rM.add_function(sub,out_image='/tmp/sub_lambda.tif')
Out:
Using datatype from numpy table : int16.
Detected 1 band for function <lambda>.
Use a python function to use arguments
def sub(X,band1=0,band2=1):
    outX = np.array((X[:,band1]-X[:,band2])).astype(np.int16)
    return outX
We can add keyword argument in the addFunction. This function is going to substract band2 from band 1
import time
t=time.time()
rM = RasterMath(raster)
rM.add_function(sub,out_image='/tmp/sub.tif',band1=1,band2=0,compress='high')
Out:
Total number of blocks : 15
Using datatype from numpy table : int16.
Detected 1 band for function sub.
Run the script
rM.run()
print(time.time()-t)
Out:
Batch processing (15 blocks using 5Mo of ram)

rasterMath... [##......................................]6%

rasterMath... [#####...................................]13%

rasterMath... [########................................]20%

rasterMath... [##########..............................]26%

rasterMath... [#############...........................]33%

rasterMath... [################........................]40%

rasterMath... [##################......................]46%

rasterMath... [#####################...................]53%

rasterMath... [########################................]60%

rasterMath... [##########################..............]66%

rasterMath... [#############################...........]73%

rasterMath... [################################........]80%

rasterMath... [##################################......]86%

rasterMath... [#####################################...]93%

rasterMath... [########################################]100%
0.9966614246368408
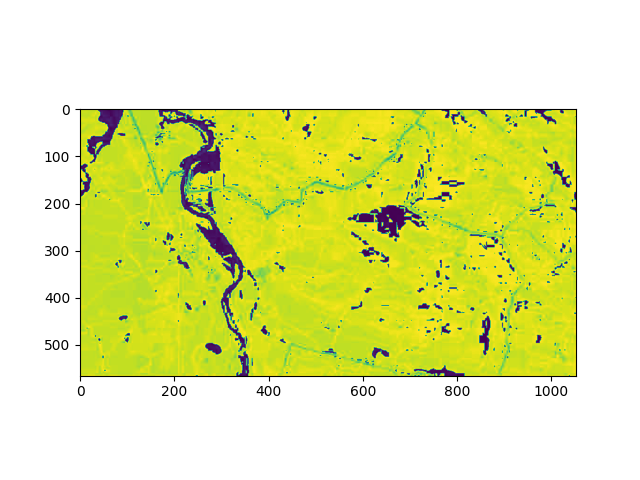
Plot result
from osgeo import gdal
from matplotlib import pyplot as plt
src = gdal.Open('/tmp/sub.tif')
plt.imshow(src.ReadAsArray())
Out:
<matplotlib.image.AxesImage object at 0x7ff5863dd310>
Total running time of the script: ( 0 minutes 1.232 seconds)