Note
Click here to download the full example code
Plot confusion matrix
Plot confusion matrix from Cross-Validation, with F1 as subplot.
Import librairies
from museotoolbox.ai import SuperLearner
from museotoolbox.cross_validation import RandomStratifiedKFold
from museotoolbox.charts import PlotConfusionMatrix
from museotoolbox import datasets
from sklearn.ensemble import RandomForestClassifier
Load HistoricalMap dataset
X,y = datasets.load_historical_data(low_res=True,return_X_y=True)
Create CV
RSKF = RandomStratifiedKFold(n_splits=2,
                random_state=12,verbose=False)
Initialize Random-Forest
classifier = RandomForestClassifier()
Start learning
SL = SuperLearner(classifier=classifier,param_grid=dict(n_estimators=[10,50]))
SL.fit(X,y,cv=RSKF)
Get kappa from each fold
for stats in SL.get_stats_from_cv(confusion_matrix=False,kappa=True):
    print(stats['kappa'])
Out:
0.9235906121461408
0.8825263426819177
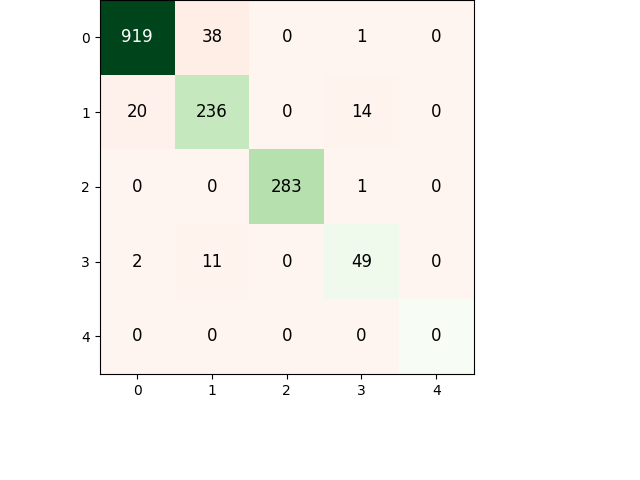
Get each confusion matrix from folds
cms = []
for stats in SL.get_stats_from_cv(confusion_matrix=True):
    cms.append(stats['confusion_matrix'])
    print(stats['confusion_matrix'])
Out:
[[924  17   0   1   0]
 [ 30 244   0  12   0]
 [  0   0 284   0   0]
 [  1  12   1  52   0]
 [  0   1   0   0   0]]
[[915  23   0   4   0]
 [ 47 229   0  10   0]
 [  0   0 283   1   0]
 [  1  17   2  46   0]
 [  0   0   0   1   0]]
Plot confusion matrix
import numpy as np
meanCM = np.mean(cms,axis=0).astype(np.int16)
pltCM = PlotConfusionMatrix(meanCM.T) # Translate for Y = prediction and X = truth
pltCM.add_text()
pltCM.color_diagonal()
Total running time of the script: ( 0 minutes 1.048 seconds)