Note
Click here to download the full example code
Leave-P-SubGroup-Out (LPSGO)
This example shows how to make a Leave-Percent-SubGroup-Out.
Import librairies
from museotoolbox.cross_validation import LeavePSubGroupOut
from museotoolbox import datasets,processing
import numpy as np
Load HistoricalMap dataset
raster,vector = datasets.load_historical_data(low_res=True)
field = 'Class'
group = 'uniquefid'
Create CV
valid_size = 0.5 # Means 50%
LPSGO = LeavePSubGroupOut(valid_size = 0.5,
                          random_state=12,verbose=False)
Extract X,y and group.
X,y,g= processing.extract_ROI(raster,vector,field,group)
Note
Split is made to generate each fold
for tr,vl in LPSGO.split(X,y,g):
    print(tr.shape,vl.shape)

print('y label with number of samples')
print(np.unique(y[tr],return_counts=True))
Out:
(1513,) (1662,)
(1785,) (1390,)
y label with number of samples
(array([1, 2, 3, 4, 5]), array([961, 371, 355,  97,   1]))
Differences with scikit-learn
from sklearn.model_selection import LeavePGroupsOut
# You need to specify the number of groups

LPGO = LeavePGroupsOut(n_groups=2)
for tr,vl in LPGO.split(X,y,g):
    print(tr.shape,vl.shape)
Out:
(2519,) (656,)
(2674,) (501,)
(2218,) (957,)
(2672,) (503,)
(2565,) (610,)
(2736,) (439,)
(2499,) (676,)
(2587,) (588,)
(2664,) (511,)
(2707,) (468,)
(2803,) (372,)
(2769,) (406,)
(2803,) (372,)
(2572,) (603,)
(2681,) (494,)
(2591,) (584,)
(2760,) (415,)
(2304,) (871,)
(2758,) (417,)
(2651,) (524,)
(2822,) (353,)
(2585,) (590,)
(2673,) (502,)
(2750,) (425,)
(2793,) (382,)
(2889,) (286,)
(2855,) (320,)
(2889,) (286,)
(2658,) (517,)
(2767,) (408,)
(2677,) (498,)
(2459,) (716,)
(2913,) (262,)
(2806,) (369,)
(2977,) (198,)
(2740,) (435,)
(2828,) (347,)
(2905,) (270,)
(2948,) (227,)
(3044,) (131,)
(3010,) (165,)
(3044,) (131,)
(2813,) (362,)
(2922,) (253,)
(2832,) (343,)
(2457,) (718,)
(2350,) (825,)
(2521,) (654,)
(2284,) (891,)
(2372,) (803,)
(2449,) (726,)
(2492,) (683,)
(2588,) (587,)
(2554,) (621,)
(2588,) (587,)
(2357,) (818,)
(2466,) (709,)
(2376,) (799,)
(2804,) (371,)
(2975,) (200,)
(2738,) (437,)
(2826,) (349,)
(2903,) (272,)
(2946,) (229,)
(3042,) (133,)
(3008,) (167,)
(3042,) (133,)
(2811,) (364,)
(2920,) (255,)
(2830,) (345,)
(2868,) (307,)
(2631,) (544,)
(2719,) (456,)
(2796,) (379,)
(2839,) (336,)
(2935,) (240,)
(2901,) (274,)
(2935,) (240,)
(2704,) (471,)
(2813,) (362,)
(2723,) (452,)
(2802,) (373,)
(2890,) (285,)
(2967,) (208,)
(3010,) (165,)
(3106,) (69,)
(3072,) (103,)
(3106,) (69,)
(2875,) (300,)
(2984,) (191,)
(2894,) (281,)
(2653,) (522,)
(2730,) (445,)
(2773,) (402,)
(2869,) (306,)
(2835,) (340,)
(2869,) (306,)
(2638,) (537,)
(2747,) (428,)
(2657,) (518,)
(2818,) (357,)
(2861,) (314,)
(2957,) (218,)
(2923,) (252,)
(2957,) (218,)
(2726,) (449,)
(2835,) (340,)
(2745,) (430,)
(2938,) (237,)
(3034,) (141,)
(3000,) (175,)
(3034,) (141,)
(2803,) (372,)
(2912,) (263,)
(2822,) (353,)
(3077,) (98,)
(3043,) (132,)
(3077,) (98,)
(2846,) (329,)
(2955,) (220,)
(2865,) (310,)
(3139,) (36,)
(3173,) (2,)
(2942,) (233,)
(3051,) (124,)
(2961,) (214,)
(3139,) (36,)
(2908,) (267,)
(3017,) (158,)
(2927,) (248,)
(2942,) (233,)
(3051,) (124,)
(2961,) (214,)
(2820,) (355,)
(2730,) (445,)
(2839,) (336,)
With GroupShuffleSplit, won’t keep the percentage per subgroup This generate unbalanced classes
from sklearn.model_selection import GroupShuffleSplit
GSS = GroupShuffleSplit(test_size=0.5,n_splits=2)
for tr,vl in GSS.split(X,y,g):
    print(tr.shape,vl.shape)

print('y label with number of samples')
print(np.unique(y[tr],return_counts=True))
Out:
(1737,) (1438,)
(1905,) (1270,)
y label with number of samples
(array([1, 2, 3, 5]), array([1242,  307,  355,    1]))
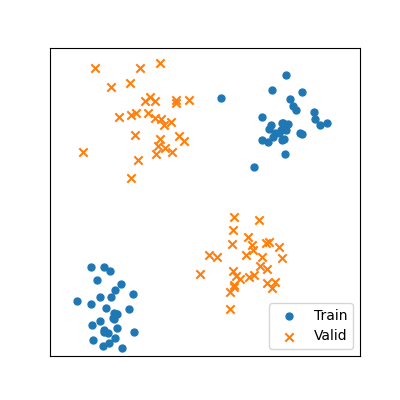
Plot example in image
from __drawCVmethods import plotMethod
plotMethod('SKF-group')
Out:
/home/docs/checkouts/readthedocs.org/user_builds/museotoolbox/checkouts/develop/examples/cross_validation/__drawCVmethods.py:35: MatplotlibDeprecationWarning: Adding an axes using the same arguments as a previous axes currently reuses the earlier instance.  In a future version, a new instance will always be created and returned.  Meanwhile, this warning can be suppressed, and the future behavior ensured, by passing a unique label to each axes instance.
  ax = f.add_subplot(111)
Total running time of the script: ( 0 minutes 0.098 seconds)